15 Software Development Metrics Every Team Should Track
How do you know if your development process is genuinely improving?
Most engineering teams rely on intuition rather than concrete data to assess their performance.
Traditional intuition-driven (or gut-feeling) approaches often lead to missed deadlines, budget overruns, and frustrated stakeholders questioning the value of development.
Software development metrics solve this problem by providing quantitative insights that transform guesswork into data-driven decisions. Organizations that implement structured metrics frameworks report improved delivery predictability and code quality, with outcomes varying based on the team’s context and the approach to implementation.
As a leading custom software development company with over a decade of experience in optimizing engineering processes for 500+ businesses across industries, we understand 15 essential metrics that drive effective results, not vanity numbers that waste time.
This guide reveals the exact KPIs top-performing engineering teams use to measure success, optimize workflows, and create business value.
What Are Software Development Metrics?
Software development metrics are quantifiable measurements that assess the performance of engineering teams, code quality, and delivery efficiency. These data points transform subjective opinions about development progress into objective insights that guide strategic decisions and process improvements, particularly valuable for custom software development projects where requirements vary significantly.
When implementing metrics in software development programs, successful organizations focus on outcomes rather than activities. This approach ensures that measurements drive meaningful improvements rather than gaming behaviors that optimize numbers without actually improving performance.
When implementing metrics in software development programs, successful organizations focus on outcomes rather than activities. This aligns with proven software development best practices that emphasize measurable results over busy work.
Software development metrics serve three critical business functions:
1. Performance Measurement: Track team velocity, identify bottlenecks, and measure improvement over time. For example, measuring cycle time reveals whether your development process is accelerating or slowing down.
2. Quality Assurance: Monitor code reliability, defect rates, and technical debt accumulation before they impact users. Teams tracking defect density often identify more issues during development phases, thereby reducing the need for costly post-release fixes.
3. Strategic Planning: Provide stakeholders with concrete data for resource allocation, timeline estimation, and ROI justification. Engineering teams with clear metrics typically find it easier to justify tooling investments to leadership through data-driven business cases, especially when working with experienced software development consultants.
Let’s check 15 essential software development metrics.
15 Essential Software Development Metrics
Successful engineering teams focus on metrics that directly impact delivery speed, code quality, and team effectiveness. Here are the 15 key metrics for software development that provide comprehensive visibility without overwhelming your team with unnecessary data points.
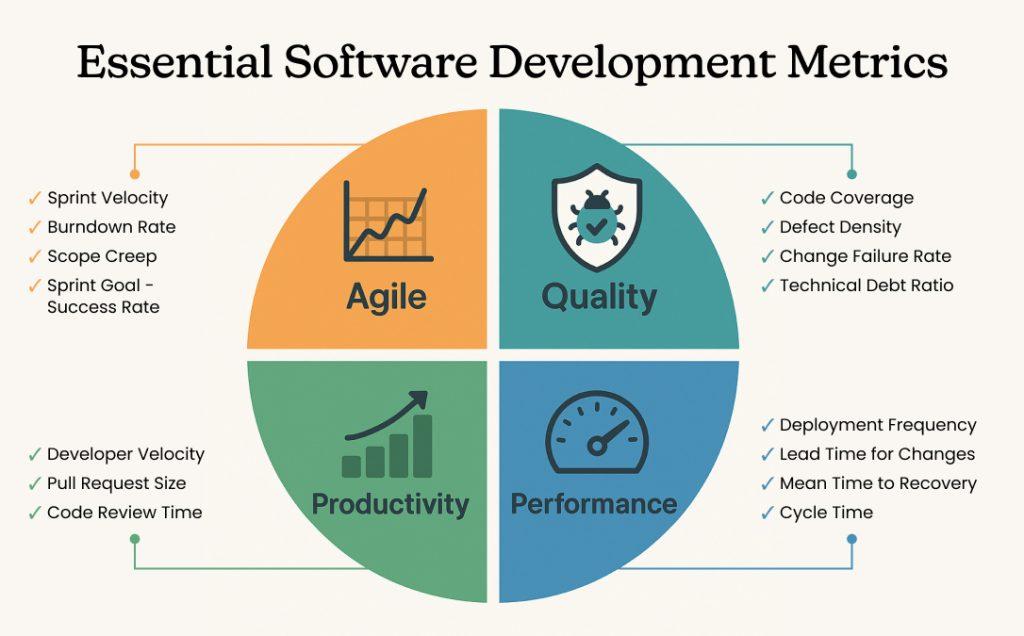
A. Agile Software Development Metrics
These metrics optimize sprint planning, track team capacity, and ensure consistent delivery within agile frameworks. Teams following the agile software development life cycle will find these measurements particularly valuable for sprint retrospectives and planning sessions.
Here are the agile software development metrics:
1. Sprint Velocity
Measures team capacity using story points completed per sprint. Calculate by averaging story points delivered over 3-5 sprints. A stable velocity (±15% variation) indicates predictable delivery capability.
Example: The team completes 45, 52, and 48 story points across three sprints, resulting in an average velocity of 48.3 story points. Use this for accurate sprint planning and realistic commitment forecasting.
Formula to calculate Sprint Velocity:
Sprint Velocity = Total Story Points Completed in Sprint
Average Velocity = Sum of Last 3-5 Sprint Velocities ÷ Number of Sprints
2. Burndown Rate
Tracks daily work completion progress against the sprint timeline. An ideal burndown follows a steady downward trajectory. Sudden drops indicate work completion clustering, while flat lines suggest blocked tasks.
Benchmark: Healthy teams maintain consistent daily progress with ±20% daily variation from the projected burndown.
Formula to calculate Burndown Rate:
Remaining Work = Total Sprint Commitment – Work Completed
Daily Burndown = Work Completed Today ÷ Total Sprint Commitment × 100
Ideal Burndown = (Days Remaining ÷ Total Sprint Days) × 100
3. Scope Creep
Monitors unplanned work added during active sprints, measured as a percentage of the original sprint commitment. High scope creep disrupts team focus and delivery predictability.
Target: Keep scope additions under 15% of the original sprint commitment. Higher percentages indicate poor requirement gathering or stakeholder boundary issues.
Formula to calculate Scope Creep:
Scope Creep % = (Added Work During Sprint ÷ Original Sprint Commitment) × 100
4. Sprint Goal Success Rate
Percentage of sprint goals achieved entirely on the scheduled timeline. Different from velocity, this measures outcome achievement versus activity completion.
Benchmark: High-performing teams often achieve 80% or higher sprint goal success rates through focused planning and scope protection, although this varies significantly by team.
Formula to calculate Sprint Goal Success Rate:
Sprint Success Rate = (Goals Achieved ÷ Total Goals Set) × 100
Rolling Average = Sum of Last 6 Sprint Success Rates ÷ 6
Here’s a table that simplifies the optimal benchmarks of the 4 Agile software development metrics:
| Metric | How to Measure | Good Performance |
| Sprint Velocity | Average story points over 3-5 sprints | Consistent (±15% variation) |
| Burndown Rate | Daily remaining work vs timeline | Steady downward trend |
| Scope Creep | Added work ÷ original commitment | Under 15% additions |
| Sprint Success | Completed goals ÷ total goals | 80%+ achievement rate |
B. Software Development Quality Metrics
Quality management metrics for software development help prevent the accumulation of technical debt and ensure the delivery of reliable software to production environments.
5. Code Coverage
Percentage of codebase covered by automated tests. Higher coverage reduces bug escape rates but requires a balance with development velocity. Focus on critical path coverage over absolute percentages.
Sweet Spot: 70-85% coverage provides optimal bug prevention without excessive test maintenance overhead.
Formula to calculate Code Coverage:
Code Coverage % = (Lines of Code Tested ÷ Total Lines of Code) × 100
Branch Coverage % = (Branches Tested ÷ Total Branches) × 100
6. Defect Density
Number of confirmed bugs per 1,000 lines of code or per feature. Lower density indicates higher code quality and more effective development processes.
Industry Context: Defect density varies significantly by software type – safety-critical systems target <0.1 defects per 1,000 lines, while typical business applications range from 3-10 defects per 1,000 lines. One IEEE study of 109 software projects found a mean of 7.47 post-release defects per 1,000 lines of code, though with significant variation (median of 4.3, standard deviation of 7.99).
Formula to calculate Defect Density:
Defect Density = Number of Defects ÷ Size of Software Module
Per KLOC = Number of Defects ÷ (Lines of Code ÷ 1000)
7. Change Failure Rate
Percentage of production deployments causing failures requiring hotfixes, rollbacks, or patches. Critical for measuring deployment reliability and development process maturity.
DORA Benchmark: Elite teams achieve <5% change failure rates through comprehensive testing and gradual rollout strategies, according to Google Cloud’s DevOps Research and Assessment program.
Formula to calculate Change Failure Rate:
Change Failure Rate % = (Failed Deployments ÷ Total Deployments) × 100
Monthly CFR = Failed Deployments in Month ÷ Total Monthly Deployments × 100
8. Technical Debt Ratio
Estimated time required to fix code issues versus time spent developing new features. Measured using code analysis tools that identify complexity, duplication, and maintainability issues.
Healthy Range: Technical debt should consume <20% of development capacity. Higher ratios indicate unsustainable development practices.
Formula to calculate Scope Creep:
Technical Debt Ratio = (Remediation Cost ÷ Development Cost) × 100
Alternative formula: Technical Debt Hours ÷ Total Development Hours × 100
C. Software Development Performance Metrics
Performance metrics measure delivery speed and system reliability, directly impacting user experience and business outcomes.
9. Deployment Frequency
Measures how frequently code changes are deployed to production. Higher deployment frequency enables faster feature delivery and reduced deployment risk through smaller change batches.
DORA Elite Benchmark: Multiple deployments per day or on-demand deployment capability indicates mature DevOps practices and automated pipeline efficiency, as defined by Google Cloud’s research.
Formula to calculate Deployment Frequency:
Daily: Number of Deployments ÷ Number of Days
Weekly: Number of Deployments ÷ Number of Weeks
Monthly: Number of Deployments ÷ Number of Months
10. Lead Time for Changes
Time elapsed from code commit to production deployment. Shorter lead times enable rapid responses to market demands and faster incorporation of feedback, directly impacting the overall software development timeline.
Measurement: Track from first commit to production release. According to DORA research, elite teams achieve lead times under 1 day, while high performers target under 1 week.
Formula to calculate Lead Time for Changes:
Lead Time = Deployment Date/Time – Commit Date/Time
Average Lead Time = Sum of All Lead Times ÷ Number of Changes
11. Mean Time to Recovery (MTTR)
Average duration to restore service functionality after production incidents. Lower MTTR indicates effective incident response processes and system resilience.
Target Ranges: Critical systems should target MTTR under 1 hour, while non-critical systems can accept 4-24 hour recovery windows.
Formula to calculate Mean Time to Recovery (MTTR):
MTTR = Total Downtime ÷ Number of Incidents
Alternative Formula = (Incident Resolution Time – Incident Detection Time) Average
12. Cycle Time
Cycle Time measures the duration from the initiation of a development task to its completion and deployment. Shorter cycle times improve feature delivery predictability and reduce work-in-progress overhead.
Task Complexity Integration: Advanced teams utilize software development task complexity metrics in conjunction with cycle time, categorizing tasks as simple (1-2 days), medium (3-5 days), or complex (5+ days). This segmentation helps identify whether delays originate from underestimated complexity or process bottlenecks.
Optimization Focus: Identify bottlenecks causing extended cycle times, typically including code review delays, testing backlogs, or deployment pipeline inefficiencies.
Formula to calculate Cycle Time:
Cycle Time = Task Completion Date – Task Start Date
Average Cycle Time = Sum of All Cycle Times ÷ Number of Tasks
D. Software Development Productivity Metrics
Productivity metrics (also known as software development efficiency metrics) evaluate individual and team output efficiency while maintaining a sustainable development pace.
13. Developer Velocity
Individual contributor output is measured by the number of completed features, resolved issues, and code contributions. Balance quantity metrics with quality indicators to avoid productivity gaming.
Balanced Approach: Combine feature completion rates with code review participation and knowledge sharing activities for holistic productivity assessment.
Formula to calculate Developer Velocity:
Individual Velocity = Story Points Completed by Developer ÷ Time Period
Team Velocity = Sum of Individual Velocities
Commits per Developer = Total Commits ÷ Number of Developers
14. Pull Request Size
Average lines of code changed per merge request. Smaller pull requests receive faster reviews, reduce merge conflicts, and enable more effective code quality assessment.
Optimal Range: Target 200-400 lines of code per pull request. Larger changes should be broken into smaller, reviewable chunks.
Formula to calculate Pull Request Size:
PR Size = Lines Added + Lines Deleted
Average PR Size = Sum of All PR Sizes ÷ Number of PRs
Small PR % = (PRs under 200 lines ÷ Total PRs) × 100
15. Code Review Time
Duration from pull request submission to approval and merge. Faster review cycles maintain development momentum while ensuring that code quality standards are met.
Efficiency Target: Reviews should be completed within 24-48 hours for regular priority changes, with critical fixes reviewed within 4 hours.
Formula to calculate Code Review Time:
Review Time = PR Merge Time – PR Creation Time
Average Review Time = Sum of All Review Times ÷ Number of PRs
Review Efficiency = PRs Reviewed within Target Time ÷ Total PRs × 100
5 Common Software Development Metrics Pitfalls to Avoid
Understanding what NOT to do with software development metrics prevents costly implementation mistakes and team dysfunction. Here are the most common pitfalls and their solutions.
1. Team members manipulate metrics
When teams focus too much on hitting numbers, they start changing their behavior to improve metrics instead of actual work quality. Developers might split simple tasks into multiple tickets to increase completion rates, or write unnecessary tests just to boost code coverage percentages.
This leads to inflated numbers that don’t reflect real productivity or quality improvements.
Solution: Track multiple related metrics together. High velocity with poor code quality indicates potential gaming behavior.
2. Tracking too many metrics at once
Teams often start with a few useful metrics, then gradually add more until they’re monitoring dozens of measurements. This creates information overload where teams spend more time analyzing data than taking action on insights.
Too much data often results in no clear decisions or improvements.
Solution: Limit tracking to 5-7 essential metrics. Each metric should have a clear purpose and lead to specific actions when targets aren’t met.
3. Measuring activity instead of results
Some teams focus on measuring effort rather than outcomes. Tracking lines of code written, hours worked, or number of commits doesn’t indicate whether the work actually solved problems or delivered value.
These activity-based metrics can make teams appear productive, but fail to achieve real goals.
Solution: Focus on outcome-based metrics, such as feature delivery time, defect rates, and customer satisfaction, rather than input measurements.
4. Using metrics for individual performance reviews
When managers use team metrics to evaluate individual performance, it creates competition instead of collaboration. Team members may hide problems or optimize for personal metrics rather than team success.
This approach damages trust and reduces the collaborative behaviors that make teams effective. Successful software development team management focuses on using data to help teams improve together rather than ranking individuals.
Solution: Use metrics for team improvement discussions, not individual performance evaluations. Focus on helping the entire team learn and improve together.
5. Applying generic benchmarks without context
Teams sometimes adopt industry benchmarks without considering their specific situation. A small startup can’t realistically match the deployment frequency of a large tech company, and different industries have different quality requirements.
Using inappropriate benchmarks creates unrealistic expectations and frustration.
Solution: Establish baseline measurements for your specific team and context first. Use industry benchmarks for reference, but set realistic targets based on your situation.
Start tracking the metrics that matter
Software development metrics turn guesswork into measurable progress. These 15 KPIs help engineering teams deliver faster, build better code, and spot problems early.
Start simply: Pick 5-7 metrics that align with your current goals. Track them consistently for a few sprints, then add more as needed. The key is consistent measurement, not perfect dashboards.
Space-O helps engineering teams implement metrics frameworks that work. Our software developers can create custom dashboards that highlight what matters most—team performance, code quality, and delivery speed—without overwhelming the data.We integrate these measurements throughout our proven software development process to ensure continuous improvement.
Ready to measure what matters? Contact Space-O to discuss implementing these metrics for your team.
Ready to transform your development metrics strategy?
Contact Space-O today to schedule a consultation on implementing these KPIs for your engineering team.
Frequently Asked Questions about Software Development Metrics
What are KPIs for software development?
Software development KPIs (Key Performance Indicators) are strategic metrics that measure the success of an engineering team against business objectives. Unlike general metrics, KPIs focus on outcomes such as feature delivery rate, customer satisfaction, and revenue impact, rather than just development activities.
What are the 4 DORA metrics?
The four DORA metrics are: Deployment Frequency (the frequency at which code is deployed to production), Lead Time for Changes (the duration from commit to deployment), Change Failure Rate (the percentage of deployments that cause failures), and Mean Time to Recovery (the average time required to restore service after an incident).
What are the key software development KPI metrics?
Key software development KPIs include sprint velocity, code coverage, deployment frequency, cycle time, defect density, and technical debt ratio. These metrics balance delivery speed, code quality, and team sustainability to provide a comprehensive assessment of engineering performance.
How do you measure the performance of a software development team?
Measure software development team performance using balanced metrics: agile indicators (sprint velocity, burndown rate), quality measures (code coverage, defect density), delivery metrics (deployment frequency, cycle time), and productivity indicators (pull request size, code review time).
Which software development metrics should startups track first?
Startups should prioritize sprint velocity, deployment frequency, and code coverage as foundational metrics. These provide essential visibility into team capacity, delivery capability, and code quality without overwhelming small development teams with excessive measurement overhead.

![]() All our projects are secured by NDA
All our projects are secured by NDA
![]() 100% Secure. Zero Spam
100% Secure. Zero Spam
*All your data will remain strictly confidential.
Trusted by


Bashar Anabtawi 
Canada
“I was mostly happy with the high level of experience and professionalism of the various teams that worked on my project. Not only they clearly understood my exact technical requirements but even suggested better ways in doing them. The Communication tools that were used were excellent and easy. And finally and most importantly, the interaction, follow up and support from the top management was great. Space-O not delivered a high quality product but exceeded my expectations! I would definitely hire them again for future jobs!”

Canada Office
2 County Court Blvd., Suite 400,
Brampton, Ontario L6W 3W8
Phone: +1 (602) 737-0187
Email: sales@spaceo.ca